
Pension and life insurance: my professional “Stockholm Syndrome.”
Despite my actuarial career in property and casualty insurance, these fields remain my passion.
A few years ago, I started putting together my notes on the subject. Fast-forward to today, I’m finally publishing it.
This 6-chapter deep dive explores:
- The future of pension systems
- Insights from the latest UBI (Universal Basic Income) research
- Implications for generational wealth and financial security
- An actuary’s perspective on millennia-old financial concepts
- Innovative solutions for the pension crisis
As an entrepreneur and actuary, I’ve attempted to bridge ancient financial wisdom with cutting-edge research & tech, offering a fresh perspective on our generational financial challenges.
Table of Content
- Chapter I. The Demographic Shift and Its Implications
- Chapter II. The Current State of Pension Systems
- Chapter III. The Millennial Generation and Retirement
- Chapter IV. Universal Basic Income (UBI) and Its Relation to Pension Systems
- Chapter V. Challenges and Opportunities for Pension System Reform
- Chapter VI. Conclusion: A Call to Action
- Appendix I. References
- Appendix II. Statistically Significant Results from the OpenResearch Study
- Appendix III. Disclaimers and Attributions
Chapter I. The Demographic Shift and Its Implications
The world is aging, and our pension systems are feeling the strain.
Fifty years ago, there were six working-age people for every retiree; now, that ratio has halved to three-to-one.
Within the next 15 years, we’re projected to hit a precarious two-to-one ratio.
It seems our demographic pyramid is transforming into a demographic cylinder, much to the chagrin of actuaries everywhere.
This shift isn’t merely a quirk of statistics; it’s a fundamental restructuring of our societal makeup. To truly grasp the magnitude of this change, let’s visualize it:
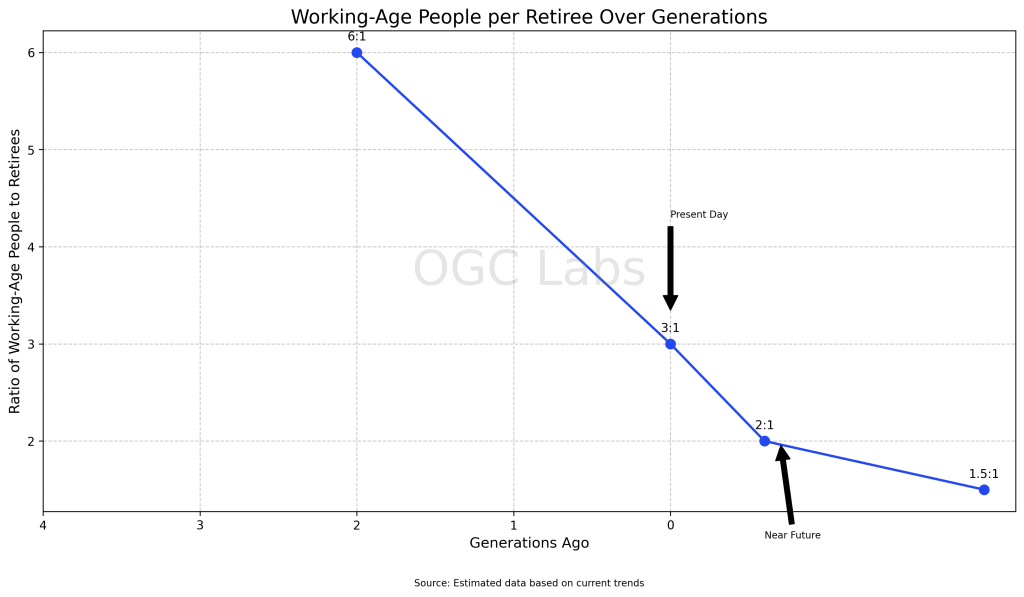
This chart starkly illustrates the rapid transformation of our demographic landscape.
The steep decline in the ratio of working-age individuals to retirees represents a seismic shift in the foundation of our retirement systems, occurring within the span of a single lifetime.
From a robust six-to-one ratio just two generations ago, we’re hurtling towards a future where we may have as few as two workers supporting each retiree.
But this is only half the story.
In parallel with this shift, we’ve witnessed an equally dramatic change in human longevity.
In just six generations—a mere blink in the 14,000-year history—we’ve doubled our life expectancy at birth.
This remarkable transformation is captured in the following chart:

As this visualization demonstrates, the trajectory of human longevity has undergone a remarkable transformation in recent history.
Just six generations ago—around the time of the Industrial Revolution—life expectancy in even the most developed countries hovered around 40 years. Fast forward to today, and we see a radically different picture.
The United States and United Kingdom, represented by the blue and red lines respectively, show a steep upward climb over the past few generations.
Japan, depicted in green, showcases an even more dramatic rise, surpassing other developed nations in life expectancy within just three generations.
Meanwhile, India and Nigeria, shown in orange and purple, illustrate the global nature of this phenomenon, with rapid increases in life expectancy occurring more recently but at an accelerated pace.
This visualization brings home a crucial point: the pension systems we rely on today were conceived in a world fundamentally different from our own.
When the first modern pension schemes were introduced in the late 19th and early 20th centuries, reaching retirement age was indeed an accomplishment.
Today, it’s an expectation. And the implications of this shift are profound.
While this longevity is cause for celebration—a testament to advancements in medicine, nutrition, and overall quality of life—it’s also giving pension fund managers sleepless nights.
Our success in extending life is simultaneously threatening the quality of life in our golden years.
Adding to this conundrum is the global trend of declining fertility rates, particularly in urbanized areas. As cities grow, cradles empty, creating a perfect storm for pension sustainability.
We’re witnessing a peculiar paradox: our triumph over mortality has inadvertently undermined the very systems designed to support us in old age.
The question before us isn’t just who will fund retirees, but how we’ll reimagine the very concept of retirement in this new demographic reality.
As we stand at this crossroads, it’s clear that the solutions of the past will not suffice for the challenges of the future.
We need innovative approaches that can adapt to our new longevity, ensuring that our golden years remain truly golden, without placing an unsustainable burden on younger generations.
In the following chapters, we’ll explore potential solutions to this demographic dilemma, including the role that concepts like Universal Basic Income might play in reshaping our approach to retirement and intergenerational support.
But first, we must fully grasp the magnitude of the change we’ve undergone—a change that has reshaped human experience more in the last six generations than in all of recorded history before it.
Chapter II. The Current State of Pension Systems
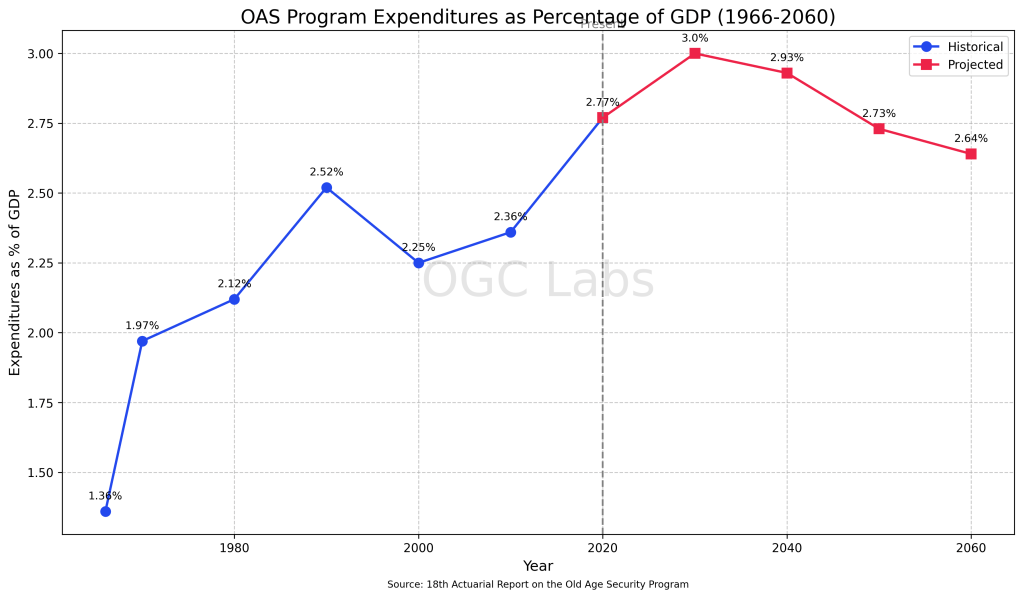
Let’s take a sobering look at Canada’s Old Age Security (OAS) Program.
According to the 18th Actuarial Report by OSFI, OAS expenditures are projected to skyrocket from $77.8 billion in 2023 to a staggering $276.5 billion by 2060.
If these numbers don’t make you reach for your calculator, please consider this: OAS expenditures are expected to peak at 3% of GDP in the early 2030s.
Golden years deserve golden price tag! And remember, this is not CPP (Canada Pension Plan), which is the invisible part of the iceberg.
The number of OAS beneficiaries is projected to nearly double from about 7 million in 2022 to 12.6 million by 2060.
This represents an 81% increase over 38 years.
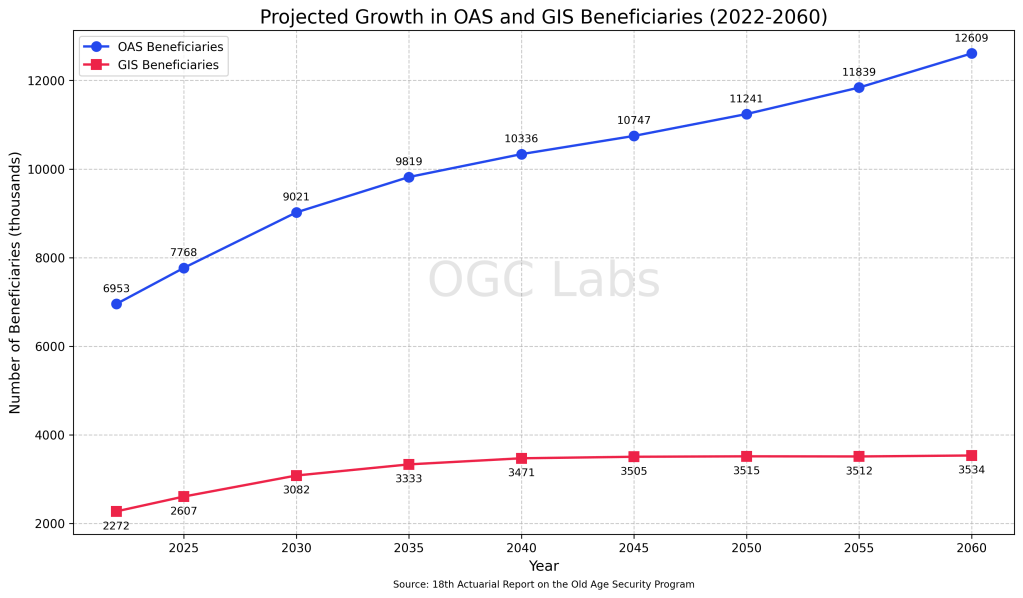
While not growing as rapidly as OAS, the number of GIS beneficiaries is also set to rise significantly, from 2.3 million in 2022 to 3.5 million in 2060, a 55% increase.
These projections underscore the urgency of reimagining our approach to retirement income security for Canada.
Is it a Canada problem?
No.
Across the Atlantic, France is grappling with its own pension predicament while organizing the century’s least spectacular, anything-but-Olympics games in Paris.
President Emmanuel Macron’s push to raise the retirement age from 62 to 64 sparked nationwide protests in 2023, where more than a million people participated and which put more than 500 people injured at the peak of the riots.
The French government argues that in 2000, there were 2.1 workers per retiree; that ratio is expected to plummet to 1.2 by 2070.
It appears the land of wine and cheese is facing a future with more retirees than vintage wines.
Chapter III. The Millennial Generation and Retirement
Millennials, those born between 1982 and 2004, are rewriting the rulebook on life milestones.
They’re delaying marriage, house-buying, and family planning, inadvertently creating a new chapter in actuarial textbooks.
According to NerdWallet’s 2018 projection, millennials should expect to retire at the ripe young age of 72.
The future of work itself is in flux.
“When you grow up, you might not have a job.”
Yuval Harari
In this brave new world, 6 out of 8 members of your extended family might be dependent when you retire.
We’re witnessing a generational shift where the concept of a stable, lifelong career culminating in a comfortable retirement is becoming as rare as a fully-funded pension plan.
The traditional three-legged stool of retirement—Social Security, pensions, and personal savings—is looking increasingly wobbly for millennials.
Personal savings are at risk.
Social security is under pressure.
Can an innovative pension system become a stronghold?
This isn’t just a problem for millennials to solve when they’re older; it’s a looming crisis that demands immediate attention from policymakers, financial institutions, and yes, even actuaries.
Chapter IV. Universal Basic Income (UBI) and Its Relation to Pension Systems
The concept of Universal Basic Income (UBI) has gained traction as a potential solution to various socioeconomic challenges, including pension sustainability.
A groundbreaking study by OpenResearch provides invaluable insights into the effects of unconditional cash transfers, offering a glimpse into a possible UBI-driven future and its implications for pension systems.
The study, involving 3,000 participants aged 21-40 with an average household income of $29,990, revealed intriguing results that challenge conventional wisdom about work incentives and financial behavior.
Income and Labour Supply
As illustrated in our first chart, the provision of $1,000 monthly for three years resulted in a decrease of $4,100 in total household income and $2,500 in individual income annually.

This was accompanied by a modest 1.28-hour reduction in weekly work hours.
These figures suggest that while UBI does impact income and work hours, the effect is not as dramatic as some critics fear.
For pension systems, where a UBI-system tied into it, this implies that a UBI-like program could provide a safety net without entirely dismantling work incentives.
Unemployment Duration

The second chart showcases an unexpected finding: the average length of continuous spells of non-employment increased by 1.09 months, with the longest spell extending by 0.85 months.
This slight increase in unemployment duration could be interpreted as participants taking more time to find suitable employment, potentially leading to better job matches and long-term career stability – a factor that could positively influence pension contributions over time.
Job Search and Entrepreneurship
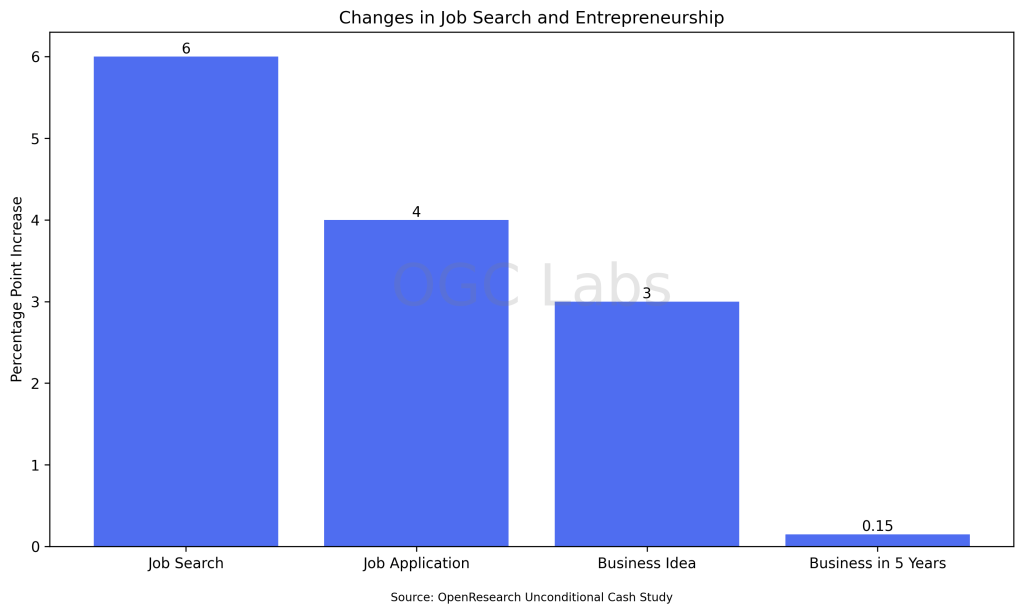
Perhaps the most promising data for future pension sustainability comes from our third chart.
The likelihood of searching for a job increased by 6 percentage points, while the probability of having a business idea rose by 3 percentage points.
Moreover, participants reported a 0.15-point increase on a 1-10 scale in their likelihood of starting a business within five years.
This surge in entrepreneurial spirit and proactive job searching suggests that UBI could foster a more dynamic, adaptable workforce.
This is a crucial factor in maintaining a robust pension system in an era of rapid technological change and lobour optimization.
Disability and Labour Market Mobility
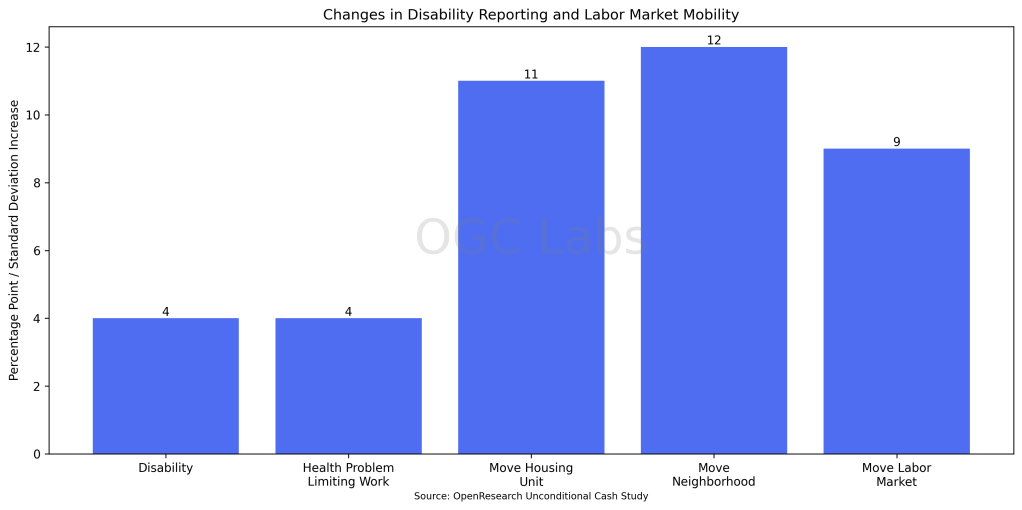
Our final chart reveals an unexpected increase in reported disabilities and health problems limiting work (both up by 4 percentage points).
Simultaneously, we see increased mobility in the labour market, with moves to new housing units, neighborhoods, and labour markets all showing positive trends.
This paints a complex picture: while UBI may allow individuals to acknowledge health limitations, it also appears to facilitate greater labour market flexibility – a potential boon to pension systems struggling with regional economic disparities.
These findings suggest that a UBI-like system could provide a foundation for a more flexible, entrepreneurial workforce while offering a safety net that allows for better long-term decision-making.
For pension systems, this could translate to:
- More stable long-term contributions as individuals find better job matches and pursue entrepreneurial ventures.
- Reduced strain on disability pension systems as individuals have the flexibility to manage health conditions without entirely exiting the workforce.
- Increased labour market mobility, potentially leading to more efficient allocation of human capital and stronger overall economic performance.
However, the slight reduction in work hours and increase in unemployment duration also highlight the need for careful policy design.
Any UBI-inspired reform to pension systems would need to balance providing security with maintaining work incentives.
As we contemplate the future of pension systems, the insights from this UBI study suggest that unconditional cash transfers could be a powerful tool in creating a more resilient, adaptable workforce.
This adaptability may be key to sustaining pension systems in an era of unprecedented demographic and technological change.
The challenge lies in designing a system that harnesses these positive effects while mitigating potential drawbacks – a task that demands innovative thinking from policymakers and pension fund managers alike.
Chapter V. Challenges and Opportunities for Pension System Reform
The current pension crisis demands a paradigm shift in our approach to retirement funding.
Traditional models, based on demographic assumptions that no longer hold true, are insufficient to meet the challenges of our aging population, evolving work landscape, mass migration due to climate crises, and changing immigration patterns.
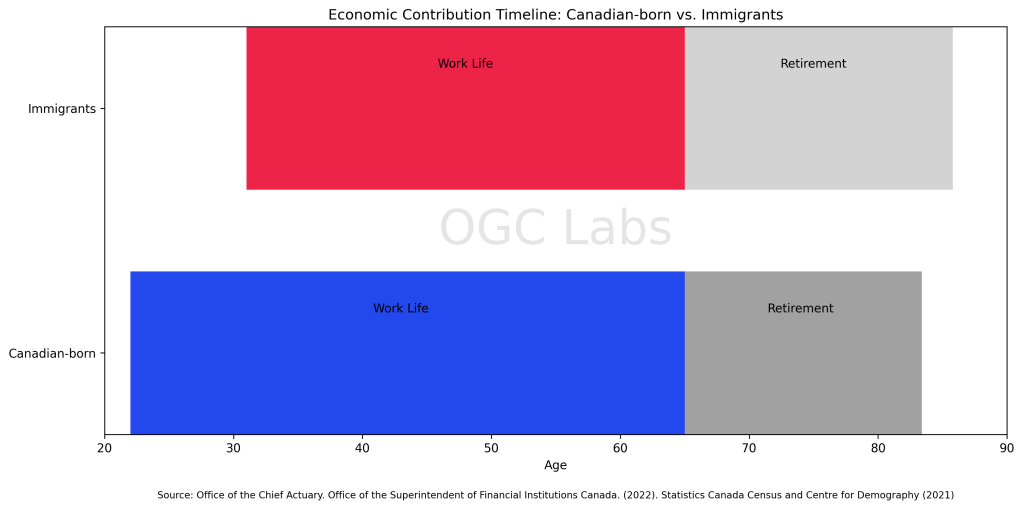
Canada’s Old Age Security (OAS) Program provides a striking example of these changing dynamics.
Statistics reveal a fascinating demographic phenomenon: immigrants to Canada tend to have a higher life expectancy at age 65 compared to their Canadian-born counterparts.
For males, the difference is 2.4 years, and for females, it’s 2.2 years. This “healthy immigrant effect” has significant implications for Canada’s pension system and overall economic landscape.

While immigrants typically enter the Canadian workforce later (median age 31) compared to Canadian-born individuals (median age 22), their longer life expectancy often results in a comparable or even extended period of economic contribution.
However, this longevity also puts additional pressure on the pension system, as immigrants draw on pension resources for a longer time in retirement.
My personal experience underscores these trends.
I became a Canadian citizen at the age of 33, after seven years of residency, five of which I was a permanent resident.
This trajectory is not uncommon and highlights why Canada must focus on creating policies to prosper high-ROI industries and attract a highly skilled workforce from abroad.
While these demographic shifts present challenges, they also offer unique opportunities for innovation in the financial sector.
Forward-thinking institutions have the potential to develop revolutionary pension models that address the generational nature of the problem while tapping into new revenue streams.
Based on our analysis, we propose three innovative business models with the potential to transform the pension landscape:
Opportunity I. The Intergenerational Risk-Sharing Platform
This model leverages blockchain technology to create a decentralized pension system where risks and rewards are shared across generations.
Participants contribute to a smart contract-governed fund that adjusts benefits and contributions based on real-time demographic and economic data.
This system could potentially:
- Reduce the impact of demographic shifts on any single generation
- Provide more transparent and equitable distribution of pension resources
- Attract younger participants by offering flexibility and potential for higher returns
Opportunity II. The Skills-Based Pension Accumulation System
This innovative approach ties pension contributions to skill development rather than traditional employment.
Participants accumulate “pension points” not just through monetary contributions, but also by acquiring and maintaining in-demand skills.
Key features include:
- Partnerships with educational institutions and industry leaders to validate and value skills
- A dynamic scoring system that adjusts point values based on market demand
- Integration with gig economy platforms to capture value from non-traditional work arrangements
Opportunity III. The Longevity-Indexed Investment Vehicle
This financial product directly addresses increased life expectancy by linking investment strategies to longevity trends.
It could offer:
- Automatically adjusting asset allocation based on aggregate mortality data
- Longevity swaps to hedge against unexpectedly long lifespans
- Personalized investment strategies using AI and big data to predict individual life expectancy
Chapter VI. Conclusion: A Call to Action
The pension crisis we face is not merely a financial challenge, but a test of our societal adaptability and innovation.
The demographic shifts and changing nature of work demand a complete reimagining of how we fund and conceptualize retirement.
The models proposed here are not merely theoretical constructs, but potential billion-dollar opportunities for institutions willing to lead this necessary revolution.
The future of pensions lies not in minor adjustments to existing systems, but in bold, technology-driven solutions that address the generational nature of the challenge.
The real question for financial leaders is not whether we can afford to radically change our approach to pensions, but whether we can afford not to.
The institutions that rise to this challenge will not only secure the financial future of generations to come but will also position themselves at the forefront of one of the most significant economic transformations of our time.
Appendix I. References
A. Government and International Organization Reports
- Office of the Chief Actuary. (2022). Actuarial Report (18th) on the Old Age Security Program as at 31 December 2021. Office of the Superintendent of Financial Institutions Canada.
- Office of the Chief Actuary. (2019). Actuarial Report (15th) on the Old Age Security Program as at 31 December 2018. Office of the Superintendent of Financial Institutions Canada.
- Office of the Chief Actuary. (2022). Actuarial Study No. 23: Mortality Projections for Social Security Programs in Canada. Office of the Superintendent of Financial Institutions Canada.
- Conseil d’orientation des retraites. (2022). Évolutions et perspectives des retraites en France. Rapport annuel du COR – Juin 2022.
- United Nations, Department of Economic and Social Affairs, Population Division. (2020). World Fertility and Family Planning 2020: Highlights (ST/ESA/SER.A/440).
- OECD. (2021). Pensions at a Glance 2021: OECD and G20 Indicators. OECD Publishing, Paris.
- World Bank. (2022). Global Economic Prospects. World Bank Group.
- World Bank. (2023). Age dependency ratio, old (% of working-age population). World Development Indicators.
- International Monetary Fund. (2023). World Economic Outlook: A Long and Difficult Ascent. IMF.
- Bank for International Settlements. (2023). Annual Economic Report. BIS.
- Statistics Canada, Centre for Demography (2021).
B. Academic Research and Books
- Harari, Y. N. (2018). 21 Lessons for the 21st Century. Penguin Random House Canada Limited.
- Börsch-Supan, A., & Coile, C. (2021). Social Security Programs and Retirement around the World: Reforms and Retirement Incentives. University of Chicago Press.
- Bloom, D. E., Canning, D., & Fink, G. (2010). Implications of population ageing for economic growth. Oxford Review of Economic Policy, 26(4), 583-612.
- Lee, R., & Mason, A. (2010). Some macroeconomic aspects of global population aging. Demography, 47(1), S151-S172.
- Aksoy, Y., Basso, H. S., Smith, R. P., & Grasl, T. (2019). Demographic structure and macroeconomic trends. American Economic Journal: Macroeconomics, 11(1), 193-222.
- Holzmann, R., & Hinz, R. (2005). Old-age income support in the 21st century: An international perspective on pension systems and reform. The World Bank.
C. Research Studies and Surveys
- OpenResearch. (2024). Unconditional Cash Study: Comprehensive Analysis of Impacts in the U.S. OpenResearch.
- NerdWallet. (2018). 2018 Graduate Survey. NerdWallet.
D. Online Data Sources and Articles
- Roser, M., Ortiz-Ospina, E., & Ritchie, H. (2013). Life Expectancy. Our World in Data.
- Howmanygenerations.com. (2024). How Many Generations of Humans Have There Been?
- Peck, A. (2017). The Life and Death of the American Middle Class. Highline.
E. News Articles and Current Events
- The New York Times. (2023). France’s Plan to Raise Retirement Age Ignites Strikes and Protests.
- Wikipedia contributors. (2024). 2023 French pension reform strikes. In Wikipedia, The Free Encyclopedia.
Appendix II. Statistically Significant Results from the OpenResearch Study
I have amalgamated all the statistical findings from the article and the below is a list of those that are statistically significant findings after adjusting for multiple hypothesis testing. These findings are indicated by † symbols in the paper.
A. Income
- Total household income (self-reported) decreased by $4,100 per year (significant at 1% level)
- Total individual income (self-reported) decreased by $2,500 per year (significant at 10% level)
B. Labour Supply
- Labour Supply Elasticity Index decreased by 0.06 standard deviations (significant at 10% level)
- Employment rate decreased by 2 percentage points (significant at 10% level)
- Hours worked per week decreased by 1.28 hours (significant at 10% level)
C. Duration of Unemployment
- Duration of Unemployment Index increased by 0.10 standard deviations (significant at 5% level)
- Average length of continuous spells of non-employment increased by 1.09 months (significant at 5% level)
- Length of longest continuous spell of non-employment increased by 0.85 months (significant at 5% level)
- Duration of unemployment at time of survey increased by 0.60 months (significant at 5% level)
- Duration of non-employment at time of survey increased by 0.72 months (significant at 5% level)
D. Job Search
- Likelihood of searching for a job increased by 6 percentage points (significant at 1% level)
- Likelihood of applying for a job increased by 4 percentage points (significant at 5% level)
E. Entrepreneurship
- Entrepreneurship Index increased by 0.05 standard deviations (significant at 5% level)
- Entrepreneurial Orientation Component increased by 0.07 standard deviations (significant at 1% level)
- Entrepreneurial Intention Component increased by 0.06 standard deviations (significant at 5% level)
- Midpoint of CRRA range implied by participant’s coin flip gamble decreased by 0.16 (significant at 5% level)
- Likelihood of having an idea for a business increased by 3 percentage points (significant at 5% level)
- Likelihood rating of starting a business in next 5 years increased by 0.15 points on a 1-10 scale (significant at 5% level)
F. Disability
- Disability Index increased by 0.09 standard deviations (significant at 5% level)
- Likelihood of having a disability increased by 4 percentage points (significant at 1% level)
- Likelihood of having a health problem or disability that limits work increased by 4 percentage points (significant at 1% level)
G. Moving Labour Markets
- Move Housing Unit Index increased by 0.11 standard deviations (significant at 1% level)
- Move Neighborhood Index increased by 0.12 standard deviations (significant at 1% level)
- Move Labour Market Index increased by 0.09 standard deviations (significant at 1% level)
- Labour Market Search Component increased by 0.11 standard deviations (significant at 1% level)
Appendix III. Disclaimers and Attributions
Independence and Funding
This article is independently written and researched. The author has no affiliation with any organization mentioned in the content. No external funding was received for the production of this work.
Non-Financial Advice
The content of this article is for informational purposes only and should not be considered as financial, investment, or retirement planning advice. Readers are encouraged to consult with qualified professionals for personalized guidance.
Data Accuracy
While every effort has been made to ensure the accuracy of the data and information presented, the rapidly changing nature of demographic and economic trends means that some figures may have changed since publication.
Forward-Looking Statements
Any forward-looking statements or projections in this article are based on current trends and available data. Future outcomes may differ due to unforeseen factors or changes in global conditions.
Third-Party Content
This article may contain links to third-party websites or reference third-party research. These are provided for convenience and informational purposes only. The author does not endorse or take responsibility for the content of external sources.
Opinions and Analysis
The opinions and analysis presented in this article are those of the author and do not necessarily reflect the views of any institutions or organizations mentioned.
Image Attribution
Cover image by Mohammad Meid on Unsplash.
Updates and Corrections
The author reserves the right to update the content of this article for accuracy or completeness. Readers are encouraged to check for the most recent version.
Feedback and Contact
For questions, comments, or corrections regarding this article, please contact me at my email at [my first name] [at] [domain name]
Copyright © [2024] [Onur Gungor – OGC Labs]. All rights reserved. No part of this publication may be reproduced, distributed, or transmitted in any form or by any means without the prior written permission of the author, except in the case of brief quotations embodied in critical reviews and certain other noncommercial uses permitted by copyright law.

Leave a Reply